Understanding your post analytics
Read the Posts analytics tab, CSV export, engagement score, and how imported Threads metrics are calculated.
What metrics MomentumHive tracks
For posted content, the app reads Threads insight data and stores snapshots over time. The main post metrics exposed in the product are:
- Views
- Likes
- Replies
- Reposts
- Quotes
- Engagement score
The scheduled jobs snapshot post metrics hourly and then expose the latest values to Analytics and post detail fetches.
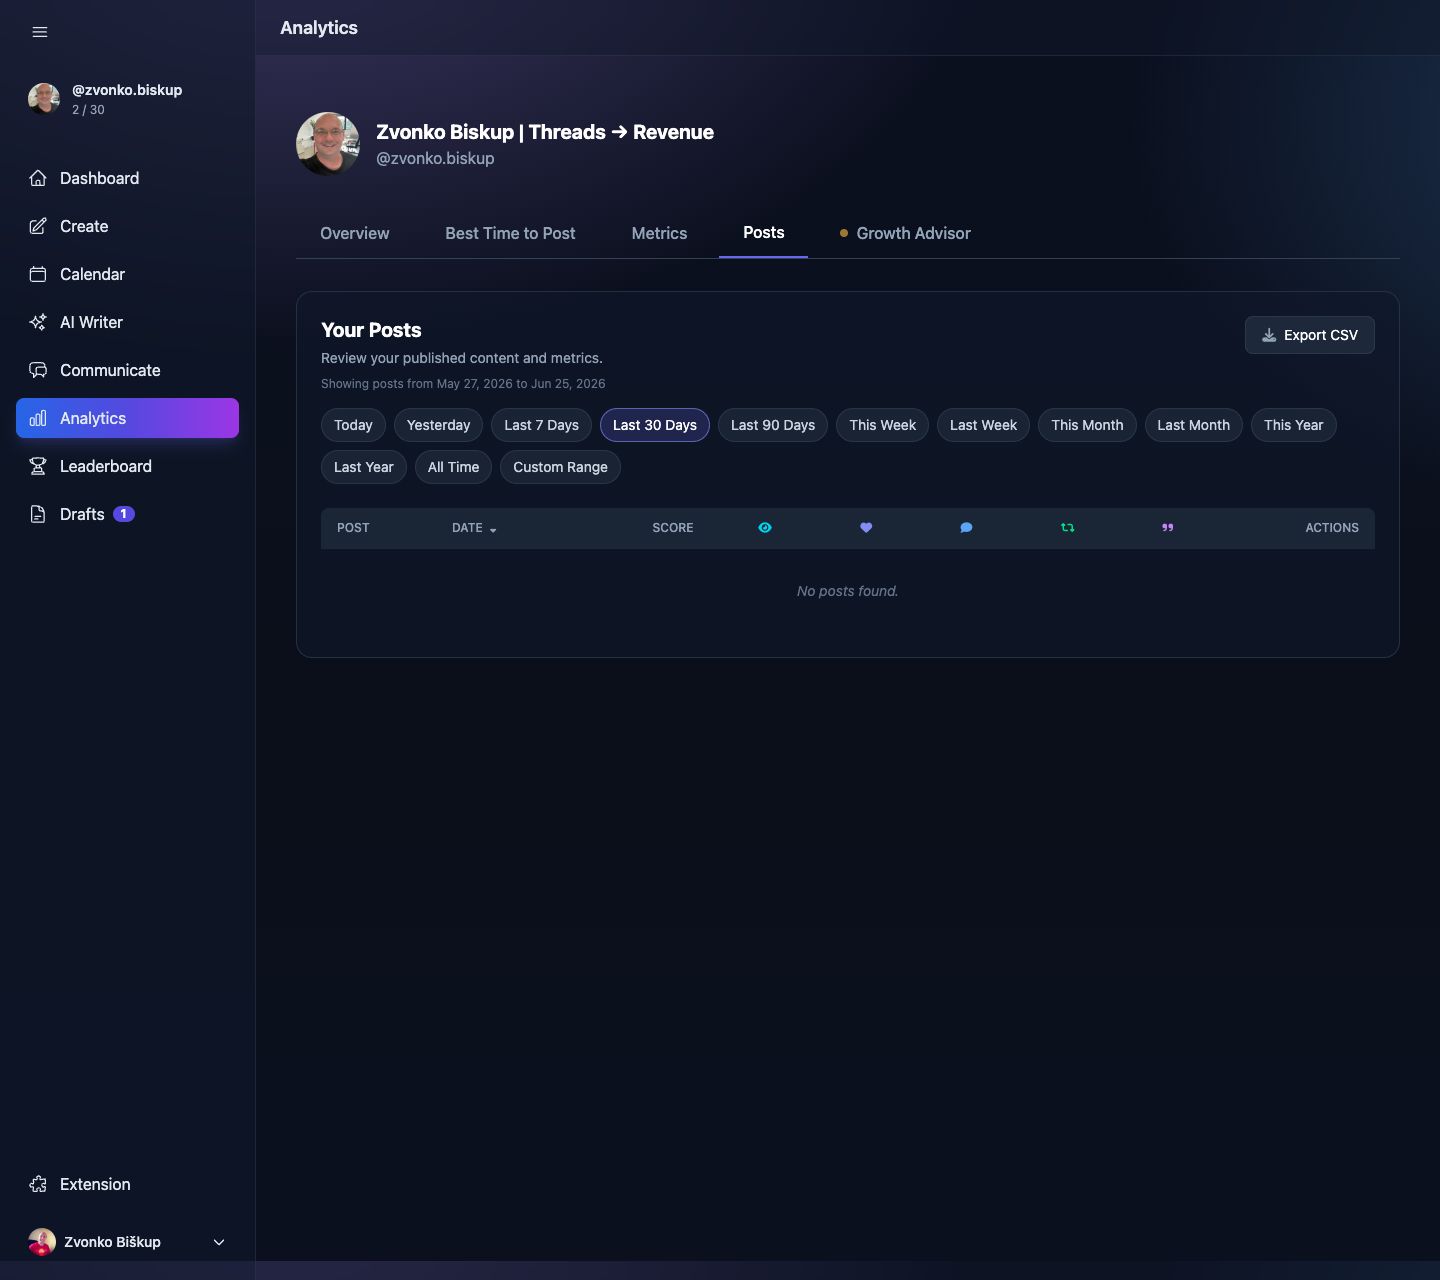
Finding post analytics
- Open Analytics.
- Switch to the Posts tab.
- Filter and sort the posted items.
- Use CSV export if you want the raw table outside the app.
Engagement score
In the post list, engagement score is calculated as likes + (replies * 2) + reposts + quotes. For thread roots, the app subtracts your own continuation replies so thread parts do not inflate audience reply counts.
Sorting and filtering
The posts endpoint supports date range filters and sorts by published_at, likes, replies, reposts, quotes, views, and engagement_score.
CSV export is the easiest way to do your own spreadsheet analysis because the file includes hook text, part count, and the key engagement metrics.